Fitting curves to your data using least squares

Content

Introduction

If you're an engineer (like I used to be in a previous life), you have probably done your bit of experimenting. Usually, you then need a way to fit your measurement results with a curve. If you're a proper engineer, you also have some idea what type of equation should theoretically fit your data.

Perhaps you did some measurements with results like this:
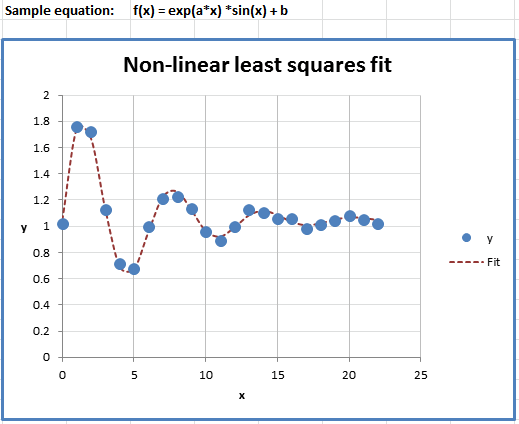
Fitting data with an equation
Fitting data with an equation.

A well known way to fit data to an equation is by using the least squares method (LS). I won't repeat the theory behind the method here, just read up on the matter by clicking that link to Wikipedia.

Fitting simple linear equations

Excel provides us with a couple of tools to perform Least Squares calculations, but they are all centered around the simpler functions: simple Linear functions of the shape
y=a.x+b, y-a.exp(b.x), y=a.x^b and etcetera. With some tricks you can also perform LS on polynomes using Excel.

Regression tools in the Analysis Toolpak Add-in

Activate the Analysis Toolpak in your list of Add-ins (File button or Office button, Excel Options, Add-ins tab, click Go):
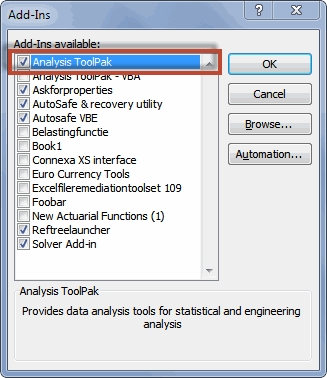
Add-ins list of Excel
The add-ins list of Excel with the Analysis toolpak activated

This adds the "Data Analysis" button to your ribbon, on the Data tab, Analysis group (this is also the location where you can find the Solver button mentioned later on):

Ribbon with Data Analysis button

Click that button to explore which regression tools are available.

Worksheet functions

There is a number of worksheet functions which you can also use to do regression analysis. To quickly access them, select an empty cell and click shift+F3 to open the function wizard. In the search box, enter "Regression" (without the quotes of course). Excel will list the relevant functions:
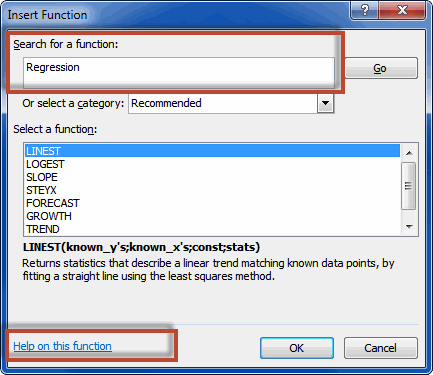
Function wizard showing Regression functions

Pick one and click on the "Help on this function" link at the bottom of the function wizard to find out more about its use.

Fitting more complex functions

What if you want to fit a more complex function, like y=exp(a.x).sin(x) + b ? How can that be done using Excel?

I devised a way to do this which involves the following steps:

  • Create a table with x and y values
  • Add a column with the model function formula, which points to your x-es and to some cells for the constant(s)
  • Have a column that calculates the Sum of Squares
  • Use Solver to find the constants which yield the lowest Sum of Squares.

Explanation of the Example file

I created an example file you can put to use directly. Below you will find a link to the file and an explanation on how the file is put together.

Download

Download this file:

Non linear least squares example

How the file works

Data

The calculations and the data are concentrated on Sheet1 of the file. The most important area is the table starting in cell A1:
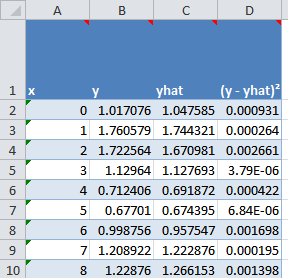
Data table in LS file

Column A holds your x-values and column B holds the y-values. The third column holds the formula that calculates the result of the fitted equation using the constants and the x-values. The sample file has this formula in column C:

=EXP(Const_a*xValues)*SIN(xValues)+Const_b

The fourth column of the table is used to calculate the sum of squares. Formula:

=(B2-C2)^2

As you probably noted already, I used a couple of range names. I explain those below.

Range names

To ease working with the file I created some range names. Instead of using the table references that current Excel offers, I included some dynamic range names that point to the data.

Range name
Refers To
Description
Const_a
=Sheet1!$G$2
Model constant
Const_b
=Sheet1!$G$3
Model constant
Const_c
=Sheet1!$G$4
Model constant
Const_d
=Sheet1!$G$5
Model constant
Const_e
=Sheet1!$G$6
Model constant
Const_f
=Sheet1!$G$7
Model constant
Const_g
=Sheet1!$G$8
Model constant
Const_h
=Sheet1!$G$9
Model constant
Constants
=Sheet1!$G$2:$G$9
constants of equation
xValues
=Table2[x]
Column with x values
yDelta
=Table2[(y - yhat)²]
Column with Squared differences
yhat
=Table2[yhat]
Column with model fit results
yValues
=Table2[y]
Column with y values

Constants of the equation

The const range names point to a second table in the file:
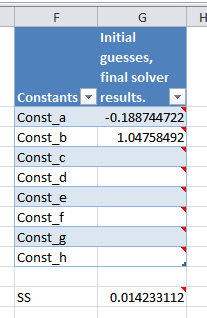
Constants table
Constants table

This table is where you enter your first initial guesses for the resulting constants and where the Solver add-in also returns the results. As you can see, below that table the residual Sum of Squares is shown. Formula:

=SUM(yDelta)

It is this cell G11 that we try to minimize using the Solver add-in.

Using Solver

First of all, you need to install the Solver add-in. Use the Add-ins dialog I showed at the top of this article and check the box next to "Solver Add-in". This adds the Solver button in the same location on the ribbon as the "Data Analysis" button I showed before.

After you have ensured the model formula is correctly entered in column C and the calculations work, click the Solver button. The dialog below is shown:
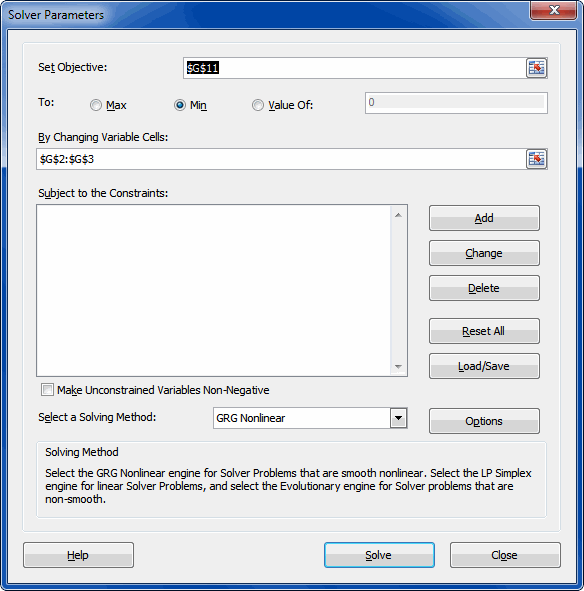
The Solver dialog
The Solver dialog

Make sure the "Set Objective" box points to the cell that contains the sum of squares. Select "Min" next to "To".

The "By Changing Variable cells" box must ONLY point to the cells that are used by your model, otherwise the degrees of freedom calculation (on the ANOVA sheet) will be wrong. Also ensure that any unused constant cells are empty by selecting them and hitting the del key.

Note that depending on your model type you may have to change the solver settings. A bit of experimenting may be needed for best results. You can save and load Solver settings using the appropriate button.

So be prudent and critical on whether or not you have actually reached a best fit, the Solver may come up with non-optimal results, depending on your model equation and solver settings.

If you're happy with the current Solver settings, click Solve. After some time the "Solver Results" dialog opens, giving you some options on how to continue. Note that it also enables you to ask for a couple of reports.

The example file shows the end result:
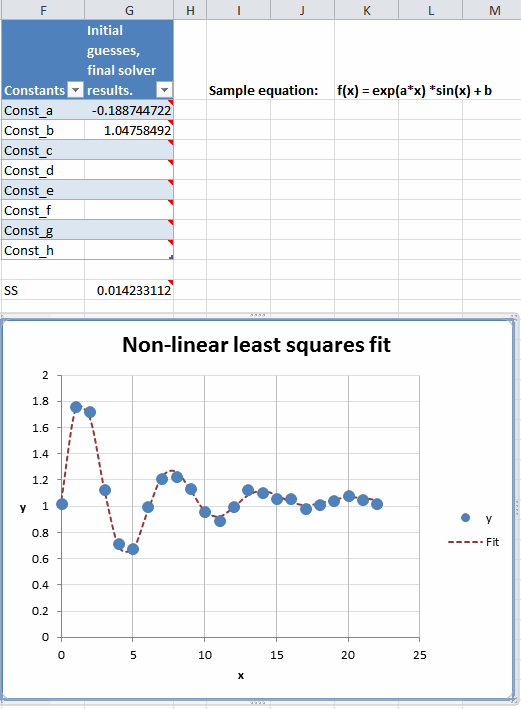
The end result
The end result

Analysis of Variance

Below the chart, you can find the ANalysis Of VAriance table, which looks like this:

The ANOVA table
The ANOVA table

The most important cell here is cell K34. If the value in that cell is less than 0.05, there is a 95% probability your model is correctly fitting the data. So less is more for this cell, you want it to stay below 0.05. The cell will turn red for values over 0.05.

Please check whether the value in cell G34 is exactly one less than the number of constants you used for the model. If not, go back to Sheet1 and empty the cells not used by your model. So if you used const_a and const_b, then the value of G34 (model degrees of freedom) should be 1.

Conclusion

As you've seen fitting complex functions to your data isn't very hard to do. A combination of some relatively simple formulas and the Solver Add-in comes to the rescue here.

Some advice as one engineer to another; Be critical please. Don't believe everything Excel tells you! Carefully analyse the results it returns, as Solver may get things wrong and not give you the best possible result!


Comments

All comments about this page:


Comment by: Hui... (14-4-2012 19:33:11) deeplink to this comment

Jan

Thats an excellent technique!
Thanx for sharing with us.

Hui...


Comment by: Mohammad (13-9-2012 03:59:56) deeplink to this comment

God bless you. This web site helped me complete daughter's home work today.


Comment by: Jan Karel Pieterse (13-9-2012 09:39:02) deeplink to this comment

Hi Mohammad,

Thank you!
Your being able to help your daughter with her homework is exactly the reason why I write these articles: to help others.


Comment by: Alex (12-11-2012 19:08:24) deeplink to this comment

Actually, you don't even need a column to calculate the square of the differences. Just replace the SUM function in G11 with the function =SUMXMY2(y,yhat)


Comment by: Martin (25-11-2012 18:55:53) deeplink to this comment

Great tool! I just used it to model damped oscillations with increasing ringing frequency with very good match.
Here is my equation:
f(x) = Const_f*exp(a*x) *sin(Const_g*x*(Const_e*exp(Const_d*x)+c) + b


Comment by: X.li (15-2-2013 12:59:41) deeplink to this comment

Best tutorial. Thanks a lot!


Comment by: xyz (1-3-2013 05:36:26) deeplink to this comment

excellent technique
helped me in my lab report


Comment by: luiz (18-3-2013 23:40:54) deeplink to this comment

thanks for share it!
I used it to equation y=A+B*X+C*X^n and it worked very well. Is it possible adapt it to estimate prediction bounds with 95% confidence?
I used to do it using originlab.
Thanks


Comment by: Jan Karel Pieterse (19-3-2013 08:17:48) deeplink to this comment

Hi Luiz,

I expect it is possible, but I do not have the needed theoretical information to build the appropriate formulas.


Comment by: Thuto (8-4-2013 22:09:25) deeplink to this comment

Hi Jan

This seems to be very informative.
But, how do you link the two tables, Table3 and Table2 so that Table3 is able to read constants in Table2?


Comment by: Jan Karel Pieterse (9-4-2013 11:41:03) deeplink to this comment

Hi Thuto,

I am not sure I understand your question, can you please try to explain what you mean?


Comment by: Thuto (9-4-2013 13:45:32) deeplink to this comment

Hi Jan,

Since you have two data tables. One with x, y,yhat,(y-yhat)^2, and the other with constants.How do you allow the data table to read const_a and const_b in the constant table in order to solve f(x)=exp(const_a*xValues)*sin(xValues)+const_b in the 3rd column of the data table?


Comment by: Jan Karel Pieterse (9-4-2013 14:32:54) deeplink to this comment

Hi Thuto,

Ah, I get it.
The method I use is as follows.

- You paste your data in the first two columns of the first table
- The subsequent columns contain formulas. The formulas in column 3 are most important, you need to write the model formula in this column yourself. The constants are defined as range names: Const_a, Const_b, Const_c, ... The xvalues are defined by the range name xValues.

So if your model is:

f(x) = exp(a*x) *sin(x) + b

then your formula in column C becomes:

=EXP(Const_a*xValues)*SIN(xValues)+Const_b


Comment by: J (10-4-2013 18:53:05) deeplink to this comment

Hi Jan,

Would it be possible to describe more on the ANOVA portion? Which were be your variables and how did you get those values eventually?


Comment by: Jan Karel Pieterse (12-4-2013 12:07:34) deeplink to this comment

Hi J,

Perhaps this link give you some pointers:

http://www.stat.yale.edu/Courses/1997-98/101/anovareg.htm

and this one:

http://chemistry.oregonstate.edu/courses/ch361-464/ch464/RegrssnFnl.pdf


Comment by: Julio Gomes (23-4-2013 02:35:49) deeplink to this comment

Thanks for the great class Jan.

I'm in fact a chemist and reading your explanation became to me two questions:
Which algorithm does SOLVER use? I see a calculation that I nedd to reproduce but it uses the Levenberg-Marquardt algorithm... Does it get such considerable diferences?
In your plan sheet furnished to us, can i use the model and just substitute the values for my system...

Gratefuly


Comment by: Jan Karel Pieterse (23-4-2013 09:55:24) deeplink to this comment

Hi Julio,

The solving methods available through Solver are listed in the dropdown, there are no other methods than listed there.

Which is the best one will depend on your model and data I'm afraid, it is hard to predict which is best for your situation.

I suggest you just try.


Comment by: Andrew (25-6-2013 11:22:54) deeplink to this comment

Thanks for the fantastic spreadsheet. The non-linear least-squares fit was really useful for me.

I have measurement errors on my y-values. How could I incorporate these into the least squares fit? Any help would be very much appreciated!


Comment by: Jan Karel Pieterse (25-6-2013 17:29:03) deeplink to this comment

Hi Andrew,

To be honest, that is beyond my knowledge!


Comment by: Carlos Cevallos (2-11-2013 20:25:14) deeplink to this comment

Which algorithm does solver use ?

Thanks you


Comment by: Jan Karel Pieterse (2-11-2013 20:51:22) deeplink to this comment

Hi Carlos,

The algorithm solver uses is one of the things you can choose. (Solving method)


Comment by: Alex (25-11-2013 06:37:49) deeplink to this comment

Andrew,


http://vizsage.com/other/leastsquaresexcel/LeastSquares.xls

If you have measurement errors on y-values, use LSFit function


if errors on both X and Y, use LSFitBoth function.

The VBA source code is provided in the spreadsheet


Comment by: GOPI YELURI (25-11-2013 08:36:27) deeplink to this comment

how to calculate sum of residual sqares in least sqare method


Comment by: Hassam (11-12-2013 10:06:41) deeplink to this comment

Dear Jan,
I followed your method. I have a similar problem I do everything correct and my initial guesses are 1 and 1. When i use solver values remain 1 solver does not seem to work. What should i do?
Regards


Comment by: Jan Karel Pieterse (11-12-2013 10:33:44) deeplink to this comment

Hi Hassam,

Hard to say.

Sometimes the formula simply isn't right for the type of data you have.

Have you tried manually inputting some guesses to see if you can get closer to the proper value?


Comment by: Srinivas Bikkina (16-2-2014 11:34:08) deeplink to this comment

Dear Sir,

I have to use a power fit to explain the relation between X and Y (equation: Y = const-a* x^-constb).

when I put my data in excel using power fit, it is very well fitted with R2 = 0.97 or 0.98. However, I would like to check the residual on the fit and significance of the fit using your macro enabled excel sheet. After my initial guess values using solver I could always get SS (the cell to be minimized) is coming of the order of ~ 2E-9 or E-10. I assume that this is very very low. However, when I refer to ANOVA table, where I found that P-value cell is showing a number error and F-value is negative. Kindly help me in this regard.


Comment by: Jan Karel Pieterse (17-2-2014 06:19:08) deeplink to this comment

Hi Srinivas,

Without knowing your data this is very hard to answer!
Please send your workbook to the email address below.


Comment by: Cui (25-2-2014 08:32:33) deeplink to this comment

HI, thanks for such detailed course on least squares fitting. I wondered if I could calculated the 95% confidence bounds for the mean response curve?


Comment by: Jan Karel Pieterse (25-2-2014 09:54:40) deeplink to this comment

Hi Cui,

If you have access to a proper statistics software package then it probably already has such an option built-in.
Getting this done in Excel is certainly possible, but I don't really know the math behind it :-)


Comment by: Wezen (9-6-2014 14:40:47) deeplink to this comment

Hey jan,
I have am facing some problems when using the solver; it always says that there is an error in the model. I have tried replacing my data with other sample data in the hopes that it would work but nothing has changed.


Comment by: Jan Karel Pieterse (10-6-2014 08:40:59) deeplink to this comment

Hi Wezen,

This is a bit hard to say without model or data :-)


Comment by: Wezen (10-6-2014 21:10:56) deeplink to this comment

Dear jan,
it seems that the solver isnt working for me even when I try and use all the data and the functions that are in the template file for the "non-linear least squares example". As soon as i change the constants and then try to solve to get the original answer back, it says that there is an error in the model; do i need to change anything in my excel setting for this file to work?


Comment by: Jan Karel Pieterse (11-6-2014 08:36:37) deeplink to this comment

Hi Wezen,

That is probably what needs to be done, yes. No idea in which way though, that requires some experimenting.


Comment by: Hammad Khan (14-7-2014 09:52:36) deeplink to this comment

very helopful page. i am really impress. I want to ask that in your
file how did you have performed ANOVA ? i followed your procedure
with your given data, and i faced no problem, but for anova, can u
guide also? that which colum should be selected and which tab? as
in excel data>data analysis gives 3 options for anova. which
should be selected.?


Comment by: Jan Karel Pieterse (14-7-2014 09:53:46) deeplink to this comment

Hi Hammad,

Unfortunately I have no time to repsond this week. I advise you to ask your question at www.eileenslounge.com.


Comment by: Sofya (4-12-2014 09:03:34) deeplink to this comment

Hi,

Actually, the method you describe in "Fitting more complex functions" is a well-known one, I studied it during my master's degree. The explanation is good, though, and it's nice that you want to share your finding, just I think that you shouldn't claim the authorship.


Comment by: Jan Karel Pieterse (4-12-2014 10:49:56) deeplink to this comment

Hi Sofya,

Well, I AM the author of this article and I did devise the spreadsheet on my own. That makes me the author, does it not? I never claimed to be the first person to write something about this and I was not expecting to either.


Comment by: Lasse Petersen (7-12-2014 20:45:27) deeplink to this comment

Hi Jan.
Im making this projekt in to school in Denmark, about the SIR model. I dont know if you know it, but in the Model there are some constants, that i need to find, and the way i have tried to do this is by using this method on the squares, between the data that i have from the recent Ebola outbreak in liberia, and the teoretical data i get by using some formulas. the problem is that it seems like excel only changes the constants very little, and it gives me a new number every time i use it. do you know what i do wrong, and can i maybe send it to you so you can help me? its a very important projekt, and it needs to be done in 10 days, so any help is appreciated.

-Lasse Petersen    


Comment by: Jan Karel Pieterse (8-12-2014 08:39:17) deeplink to this comment

Hi Lasse,

Send a copy of the file by email, I will have a look.


Comment by: Simon Eaton (7-1-2015 20:35:53) deeplink to this comment

Very nice spreadsheet which makes it easy to do non linear fits, results agree well with another program which I use. Although I get a nice fit graphically for a 3-parameter equation, I cannot get a p-value for the ANOVA as the ANOVA sheet gives a negative F-value (which cannot yield a p-value). The degrees of freedom are correct in B2 and B3, and the negative arises from a negative value in C3 (i.e. the error sum of squares), which in turn arises because the Total sum of squares is less than the model sum of squares. I assume I'm doing something dumb here, but can't see what is wrong. Any ideas?

-Simon


Comment by: Jan Karel Pieterse (8-1-2015 13:16:41) deeplink to this comment

Hi Simon,

Can you perhaps email that file to me (see address at bottom of page)?


Comment by: Francisco Puerta (9-1-2015 22:55:07) deeplink to this comment

Thank you. You wrote a well explained article, straight to the point, simple to understand. I am using it. God bless.


Comment by: CHAYEH (22-1-2015 15:15:50) deeplink to this comment

Thanks a lot!! A useful and pratical article. Thank you again and again :))


Comment by: Kevin Doggett (10-3-2015 13:34:48) deeplink to this comment

I have looked through your example and I believe I can use the method to curve fit my data, but I do not see how to determine the correlation coefficient R or R^2. Am I missing something obvious? Any suggestions?


Comment by: Jan Karel Pieterse (10-3-2015 13:52:05) deeplink to this comment

Hi Kevin,

I'm not entirely sure, my first reponse was that r-squared only applies to linear fits. But I'm not even sure on that :-)


Comment by: DC (26-3-2015 13:23:58) deeplink to this comment

Thank you for your informative resource.

I've just launched a free online tool to do this type of curve-fitting in a much simpler way. It's free to use, does not require any download and exports results to Excel. See http://www.mycurvefit.com.

I welcome any feedback you can provide.


Comment by: DC (26-3-2015 13:44:46) deeplink to this comment

And here is how your example data appears on the site:

http://www.mycurvefit.com/index.html?action=openshare&id=08cfa3e5-37a3-4187-b4ac-97108639acb2

I hope to hear from you!

All the best,

Darren


Comment by: Jan Karel Pieterse (26-3-2015 14:04:32) deeplink to this comment

Hi DC,

Interstingly, it seems your ANOVA returns slightly different results from mine?


Comment by: DC (26-3-2015 17:51:58) deeplink to this comment

Thanks Jan,

The earlier link included only the first 9 rounded values (from the screen image). The following includes the whole data set pasted in from your Excel document (from your downloads page):

http://www.mycurvefit.com/index.html?action=openshare&id=e9975460-3d24-46b9-a6b4-18f98d1c17e7

Here the results are much closer.

The results displayed on the web-page show values to 7 sig figs. In this case the calculated coefficients are almost equal to Solver's. I would expect a slight difference in the results based on the different implementations of the minimisation process. In both cases the results are very good.


Comment by: Jan Karel Pieterse (26-3-2015 18:24:08) deeplink to this comment

Hi DC,

I wasn't referring to the fitted constants but rather to the value of F. yours shows 954, I seem to have 383. Not sure which is correct :-)


Comment by: Duncan (27-3-2015 15:01:16) deeplink to this comment

Hello,
Am a university student working on my final year project.

Using an empirical formula in the form of y=A*x^(B)*z^(C), I want to determine the constants A,B, and C based on experimental resuts of y,x, and z using least-square fit method but i have failed. Any help would be welcome.
Thank you


Comment by: Jan Karel Pieterse (30-3-2015 15:21:29) deeplink to this comment

Hi Duncan,

It may very well be that Solver is having difficulties solving your problem. The only advice I can give you is to experiment with the settings of solver.
If you have an idea in what range the A, B and C values should be, it will also help setting thoes as initial values prior to running solver.


Comment by: Cap (29-10-2015 17:08:18) deeplink to this comment

Hello,

I'm neither a math nor statistics expert, so please humor me - once a curve is fitted to the data, is it possible for the equation of the curve to provide a value in order to compare different curves to each other?


Comment by: Jan Karel Pieterse (29-10-2015 17:22:54) deeplink to this comment

Hi Cap,

Yes of course, that is what the curve fitting is all about :-) Basically, that is precisely what happens in column C of the demo file.


Comment by: Cap (29-10-2015 17:41:02) deeplink to this comment

Thank you for your reply.


Comment by: Devika (23-3-2016 20:47:44) deeplink to this comment

Hi. Thanks for your tutorial but I have difficulty to follow. I need to derive a, b and c parameters using the equation below
p = a + b (1 – e -ct )
I have my data set Y for different T time in hours.
Any simple way you can suggest I use solver to do that and to do the curve fitting as well as R square value?
thanks


Comment by: Fuso (30-3-2016 19:05:48) deeplink to this comment

Thanks a lot! These were very helpful & clear steps... I was able to apply to other fits


Comment by: Mathias (1-4-2016 11:18:33) deeplink to this comment

Dear Jan,
I'm using your application to fit y = 0.5*(1+TANH(alfa*( x - beta ))) to a dataset, at first sight the fit looks good. However, when I go to the ANOVA tab I get a " #NUM! " error for the P-value in cell F2. The cause for this seems to be the value in E2 under 'F', which is negative. Also the 'Sum of squares' for the error (cell C3) is negative, which seems a bit odd. Any thoughts on what could be the cause?
Kind regards, Mathias


Comment by: Ali (3-4-2016 02:28:55) deeplink to this comment

Dear Sirs,
I am trying to solve an optimization problem in which I need to make non-linear least square fitting. the function is as follows:
y(t)=(x/R)+[y(0)-(x/R)]^t/F
so y is a function of time which I know, along with x, and y(0). I have several points for these. I need to find the values of R & F that would create a curve that fits these values. Is this doable using this technique?


Comment by: Jan Karel Pieterse (4-4-2016 09:13:56) deeplink to this comment

@Mathias:

I don't really know. Perhaps you can email your workbook to me? See address at bottom of page.

@Ali:
Have you tried to do it?


Comment by: GB (20-4-2016 05:51:03) deeplink to this comment

this is awesome!! thank you


Comment by: Boris (13-12-2016 19:10:57) deeplink to this comment

Sir, i m trying to fit thin layer drying models using non linear regressions method but i m unable to find the values of constant parameters. I need the values of constants. Pliz help
One Example of the equation
MR = a*exp(-k*t)+c, where MR-MOISTURE RATIO, t- time;a, k, c-constants


Comment by: Jan Karel Pieterse (19-12-2016 10:18:40) deeplink to this comment

Hi Boris,

Unfortunately, without proper guesses for the parameters, Excel is sometimes unable to solve the parameters.


Comment by: Boris (26-12-2016 15:44:42) deeplink to this comment

Thank you sir for ur lesson. But one thing i want to know from you is that, is there any other option to find out the values of constants without assumption firstly(means the ranges u have taken)?
Boris Huirem


Comment by: Jan Karel Pieterse (30-12-2016 15:12:26) deeplink to this comment

Hi Boris,

I'm afraid that can be the hard part. Depending on the precise model and data starting from a good set of first guesses can be very important. I have no suggestions other than trial and error I'm afraid.


Comment by: Steven (4-1-2017 18:00:41) deeplink to this comment

Is there actually a way to calculate Std Errors for the fitted const_a and const_b ?


Comment by: Jan Karel Pieterse (5-1-2017 06:46:56) deeplink to this comment

Hi Steven,

I've never had the chance to try to figure out the math behind determining the accuracy (reliability) of the fitted constants, sorry!


Comment by: Steven (6-1-2017 11:32:59) deeplink to this comment

I actually found a macro (SolvStat) online that can do this; I'm not a mathematician, so I couldn't follow all calculations in it, but it seems to work OK (after comparison with results by another program).


Comment by: Sascha (23-1-2017 10:59:29) deeplink to this comment

Hi,
thank you for your fine explanation, it works for me also with 2 independent variables. But, is there the possibility to solve multiple data sets?
E.g. I have x1=temperatur, x2=degree of cure and y=speed of cure. With e.g. 3 different heating rates I get 3 x-y data sets.
Thanks


Comment by: Jan Karel Pieterse (23-1-2017 14:46:53) deeplink to this comment

Hi Sacha,

For problems like that dedicated stats packages are a lot more capable.


Comment by: sumaira ibrahim (31-1-2017 21:46:50) deeplink to this comment

very helpful. i am a chemistry researcher and i need this for multi component analysis.


Comment by: Anthony Lucio (2-2-2017 21:00:43) deeplink to this comment

Hello,

I am attempting to use your spreadsheet to model my own data and curves. One question I have is how do you fit more than two parameters? The one discussed above uses two fit parameters but I would like to fit either three, six or nine parameters. Basically, can we extend the worksheet to optimize for Const_c through Const_i? I should mention I am using complex variable equations. I have gotten to the point where I can fit a curve manually by guess/check with MS Excel for three input parameters but I would like to extend it to six or nine, which is cumbersome to attempt manually and would be easier done with the Solver tool IMO. Thanks in advance for any help! Feel free to send me an email as well.

Cheers,
Anthony


Comment by: Jan Karel Pieterse (3-2-2017 11:49:21) deeplink to this comment

Hi Anthony,

You should be able to use the default 8 parameters the file already allows you to use (const_a to h). If you need more, you can extend the table containing the constants. You do need to make sure each constant has a range name pointing to its cell. You can do so by selecting the table (not its header) with the constants and choosing Formulas, Create From Selection and only checking the box "Left Column".


Comment by: Gosia (8-2-2017 19:13:25) deeplink to this comment

Hello,

I try to find 2 parameters within the function containing exponential functions and changing with time two variables:m and p.
I've tried to insert columns to the right of the column with x values (time in my case). Unfortunately, solver doesn't work.
Is there any reason for that?

I've called my columns x, m, p containing values at a specified times. My modelled solution I put in the "yhat" column and real data of solution in y column.

I think that I'm not aware of some function of solver (I don't know, maybe there's a different way to mark those 3 columns as variables changing with time), I'll appreciate any hint.

Gosia


Comment by: Roman Pienzer (9-2-2017 12:43:22) deeplink to this comment

Hi Jan,

a question regarding the ANOVA.

In the sheet that you provided, the degrees of freedom are calculated with reference to the amount of yvalues.

Conducting an ANOVA with Excel's built in Data Analysis Tool on the other hand, the degrees of freedom are calculated as K*(n-1), which means both the number of yvalues and yhats are being counted.

Obviously this leads to differing results, in my case with df(JKP)=36 vs df(Excel)=72.

How do I choose the appropriate method? What's the rationale behind only counting the yvalues?

Many thanks for the great sheet and your support in advance!

Roman


Comment by: Jan Karel Pieterse (9-2-2017 16:01:04) deeplink to this comment

Hi Roman,

As far as I know, the number of degrees of freedom equals:

Number of y-values - Number of constants in model - 1

Which is what the formula calculates. But I might be wrong of course :-)


Comment by: Jan Karel Pieterse (9-2-2017 16:02:37) deeplink to this comment

Hi Gosia,

I'm not sure what the problem is I'm afraid :-)


Comment by: Sadra Karimzadeh (8-1-2018 17:21:05) deeplink to this comment

Thank you for such informative explanation, I really enjoyed. However I have a problem, hope that you help me out. I have a polynomial function which has both linear and exponential parts (please see the function here >> https://www.dropbox.com/s/0kxt3ez02dh200r/polynomial.png?dl=0). How can I estimate the coefficients in such example?
Best,
Sadra.


Comment by: Jan Karel Pieterse (9-1-2018 08:18:36) deeplink to this comment

Hi Sadra,

I would expect that fitting a function like that should just work.


Comment by: Qusay Alkaseasbeh (1-4-2018 22:28:08) deeplink to this comment

Great job. Thanks a lot.

I have a question about ANOVA. You give a table in the 2nd sheet to find some statistical parameters which are telling how much your fitting id good.

In excel, there are some ANOVA (single factor, two factors, ..) which one I can use to come with same parameters as you have in the 2nd sheet?

Once again, Thanks!

Regards,
Qusay


Comment by: Jan Karel Pieterse (3-4-2018 09:58:07) deeplink to this comment

Hi Qusay,

If you go into File, Options and click the add-ins tab and then the Go... button, you may find an add-in called the Analisys toolpak. Check that box and find a new entry on your Data tab which has features like you asked for.


Comment by: Tran Hoang (8-4-2018 13:33:47) deeplink to this comment

Great! I'm kinda beginner and I'm kind of struggling to fit one of the models I try to use for my paper. Helped a lot. Many thanks


Comment by: Jan Karel Pieterse (9-4-2018 08:39:19) deeplink to this comment

Hi Tran,

You're welcomme!


Comment by: Audu Innocent (9-4-2018 15:45:54) deeplink to this comment

Pls I can't open this file nonlinearls.zip
My excel said it is corrupt. Pls help.
Thanks


Comment by: Jan Karel Pieterse (9-4-2018 16:35:22) deeplink to this comment

Hi Audu,

Odd, the file works fine for me!
Perhaps try to download the file again?


Comment by: Collin (25-7-2018 05:42:22) deeplink to this comment

Hello,
I have modified your spreadsheet to fit an exponentially modified Gaussian distribution to my own data, but it seems that solve only fits const_a, leading to an undesirable fit. Is there a way to change this?


Comment by: Jan Karel Pieterse (25-7-2018 09:52:51) deeplink to this comment

Hi Colin,

Admittedly, not all curve types are eaily solved using solver. A lot may depend on solver settings such as initial values and solving method. I have no general rules for that, I'm afraid you will have to experiment.


Comment by: Wei (15-8-2018 17:02:24) deeplink to this comment

Great job. Thanks a lot! It worked fine for my data.


Comment by: Apurva (18-2-2020 10:24:00) deeplink to this comment

How did you get the ANOVA tab? Was it separately run after the Solver published the results? If it was separately run, please guide on how to generate the same.


Comment by: Jan Karel Pieterse (18-2-2020 10:43:00) deeplink to this comment

Hi Apurva,

I created the ANOVA tab manually, using formulas. So you can study the formulas to see how they are constructed.


Have a question, comment or suggestion? Then please use this form.

If your question is not directly related to this web page, but rather a more general "How do I do this" Excel question, then I advise you to ask your question here: www.eileenslounge.com.


To post VBA code in your comment, use [VB] tags, like this: [VB]Code goes here[/VB].